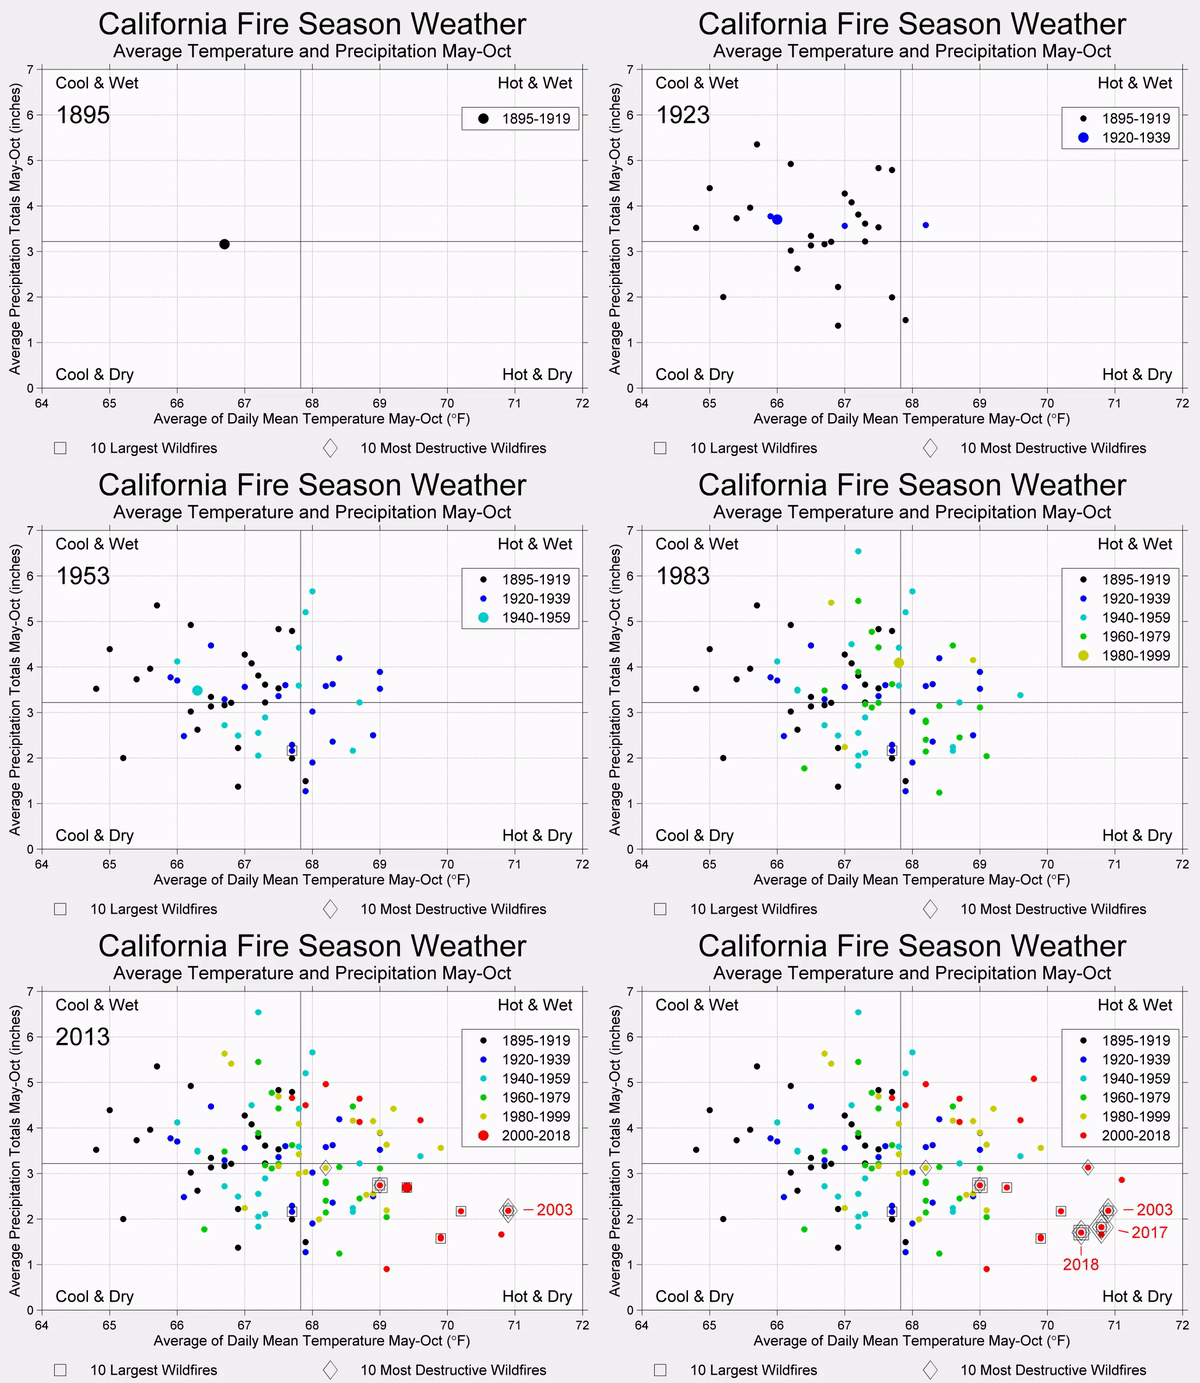
This animation shows how temperature and precipitation has changed during fire season from 1895 to 2018.
The graphic was created in 2018 by Robert Rohde, a physicist and lead scientist and Berkeley Earth, a nonprofit established by scientists to research climate change and reduce greenhouse gases.

UPDATED: Please read and follow our commenting policy: