Counties with the worst commutes in California
Commuting easily ranks as one of the least enjoyable parts of a person's day. Commuters encounter more physical health problems, and low-income commuters are less likely to gain financial stability—among a host of other negative impacts. And yet, America's commutes keep getting longer as people move farther away from the office, according to Census Bureau data.
Stacker compiled a list of counties with the worst commutes in California, using 2021 data from the Census Bureau. Counties are ranked by longest average commute time in 2021 among workers over the age of 16, excluding those who work from home. Think you have a long trip to work? Read on to compare it against the worst commutes statewide.
#58. Inyo County
- Average commute to work: 15.5 minutes
- Share with commutes over an hour: 2.8%
- Share that worked outside their county of residence: 9.7%
- Means of transportation to work:
--- Drove alone: 69.3%
--- Carpooled: 11.9%
--- Public transportation: 0.3%
--- Walked: 5.9%
--- Bicycle: 4.1%
--- Taxicab, motorcycle, or other means: 1.6%
--- Worked from home: 6.9%
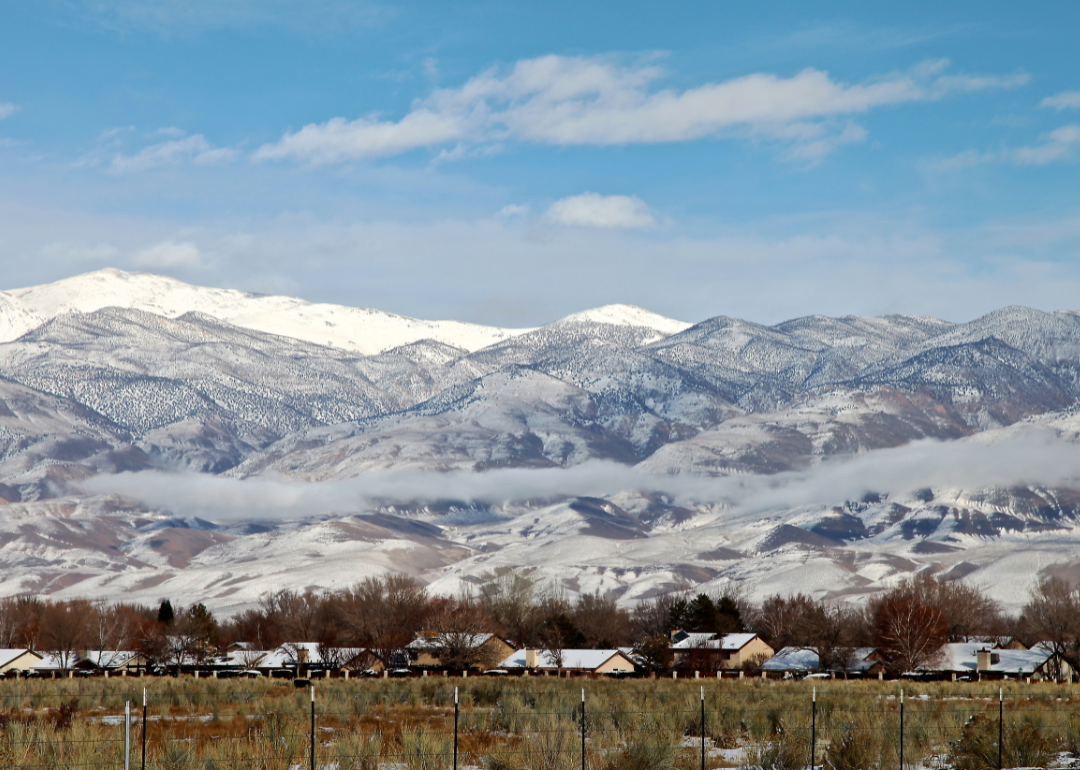
#57. Mono County
- Average commute to work: 16.4 minutes
- Share with commutes over an hour: 3.7%
- Share that worked outside their county of residence: 11.2%
- Means of transportation to work:
--- Drove alone: 57.3%
--- Carpooled: 12.8%
--- Public transportation: 11.1%
--- Walked: 6.5%
--- Bicycle: 2.3%
--- Taxicab, motorcycle, or other means: 0.5%
--- Worked from home: 9.5%
#56. Del Norte County

- Average commute to work: 16.8 minutes
- Share with commutes over an hour: 4%
- Share that worked outside their county of residence: 3.1%
- Means of transportation to work:
--- Drove alone: 75.5%
--- Carpooled: 13.6%
--- Public transportation: 0.5%
--- Walked: 4%
--- Bicycle: 0.3%
--- Taxicab, motorcycle, or other means: 0.6%
--- Worked from home: 5.4%
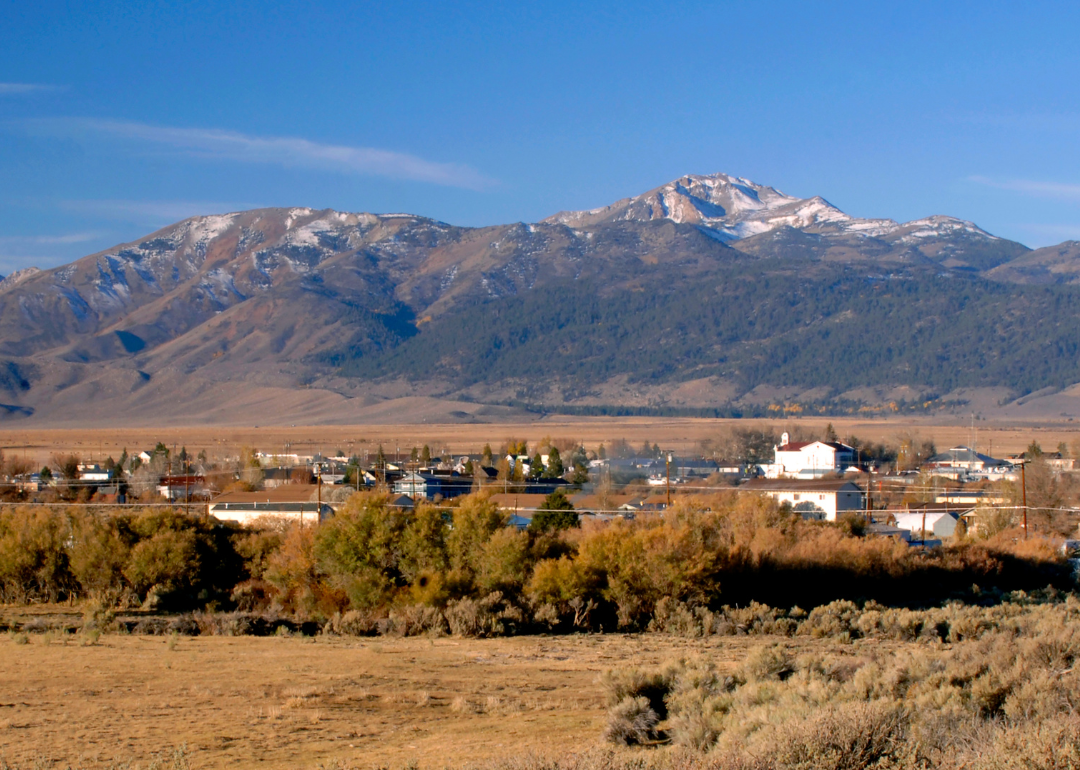
#55. Plumas County

- Average commute to work: 18.1 minutes
- Share with commutes over an hour: 8.9%
- Share that worked outside their county of residence: 4.5%
- Means of transportation to work:
--- Drove alone: 79.2%
--- Carpooled: 7.4%
--- Public transportation: 0.3%
--- Walked: 4.8%
--- Bicycle: 1.3%
--- Taxicab, motorcycle, or other means: 0.4%
--- Worked from home: 6.7%
#53. Humboldt County (tie)

- Average commute to work: 19.2 minutes
- Share with commutes over an hour: 4.7%
- Share that worked outside their county of residence: 1.2%
- Means of transportation to work:
--- Drove alone: 68.7%
--- Carpooled: 10.7%
--- Public transportation: 1.3%
--- Walked: 5.9%
--- Bicycle: 0.9%
--- Taxicab, motorcycle, or other means: 1.5%
--- Worked from home: 10.9%
#53. Siskiyou County (tie)

- Average commute to work: 19.2 minutes
- Share with commutes over an hour: 6%
- Share that worked outside their county of residence: 4.3%
- Means of transportation to work:
--- Drove alone: 75.2%
--- Carpooled: 9%
--- Public transportation: 0.3%
--- Walked: 4.9%
--- Bicycle: 0.8%
--- Taxicab, motorcycle, or other means: 0.6%
--- Worked from home: 9.3%
#51. Santa Barbara County (tie)
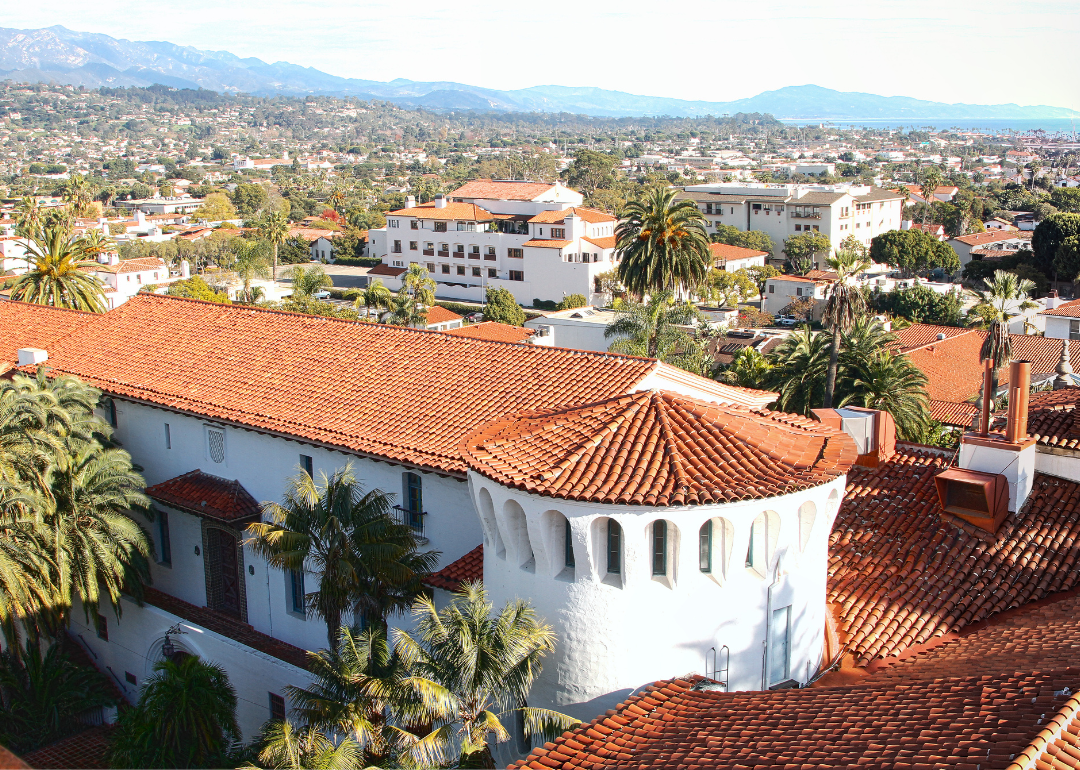
- Average commute to work: 20.7 minutes
- Share with commutes over an hour: 4.9%
- Share that worked outside their county of residence: 6.8%
- Means of transportation to work:
--- Drove alone: 67.5%
--- Carpooled: 12.4%
--- Public transportation: 2.3%
--- Walked: 4%
--- Bicycle: 2.6%
--- Taxicab, motorcycle, or other means: 1.1%
--- Worked from home: 10.1%
#51. Shasta County (tie)
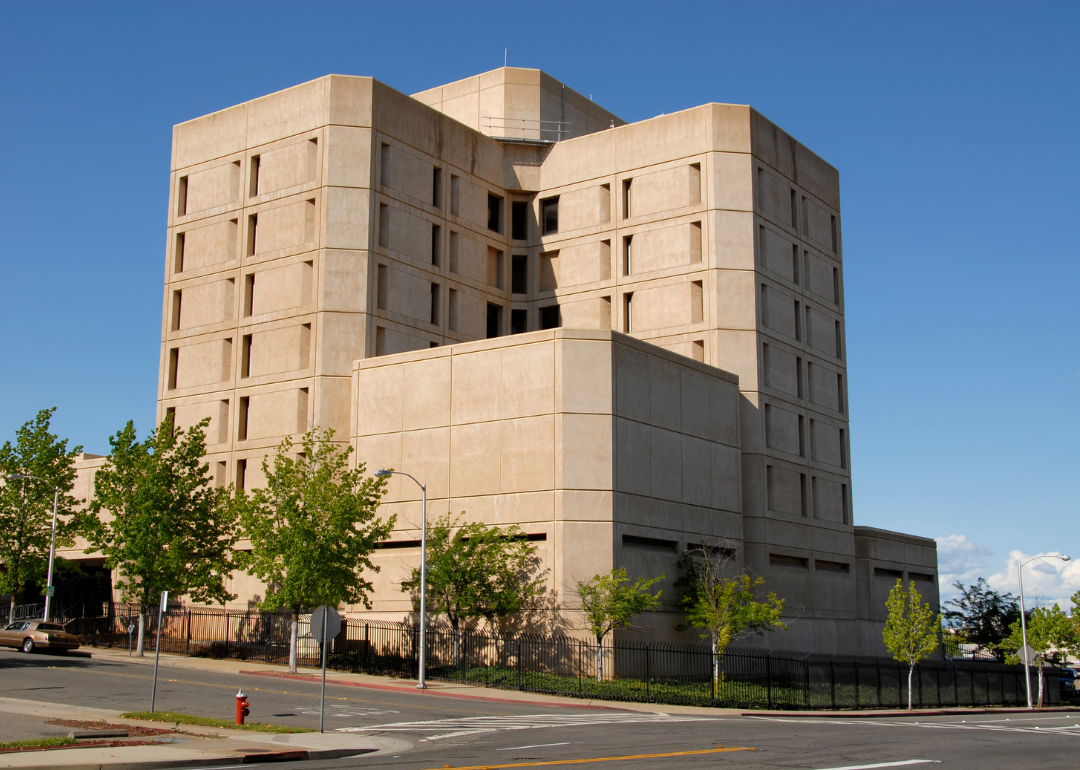
- Average commute to work: 20.7 minutes
- Share with commutes over an hour: 5.2%
- Share that worked outside their county of residence: 6.7%
- Means of transportation to work:
--- Drove alone: 79.2%
--- Carpooled: 9%
--- Public transportation: 0.4%
--- Walked: 2.3%
--- Bicycle: 0.7%
--- Taxicab, motorcycle, or other means: 1%
--- Worked from home: 7.4%
#50. Mendocino County
- Average commute to work: 20.8 minutes
- Share with commutes over an hour: 7.7%
- Share that worked outside their county of residence: 6.8%
- Means of transportation to work:
--- Drove alone: 73%
--- Carpooled: 9.6%
--- Public transportation: 0.2%
--- Walked: 6.3%
--- Bicycle: 0.2%
--- Taxicab, motorcycle, or other means: 0.9%
--- Worked from home: 9.7%
#49. Lassen County

- Average commute to work: 20.9 minutes
- Share with commutes over an hour: 4.4%
- Share that worked outside their county of residence: 6.1%
- Means of transportation to work:
--- Drove alone: 79.2%
--- Carpooled: 12.1%
--- Public transportation: 0.3%
--- Walked: 2.2%
--- Bicycle: 0.2%
--- Taxicab, motorcycle, or other means: 0.5%
--- Worked from home: 5.5%


UPDATED: Please read and follow our commenting policy: